Monthly Market Insight - July 2022
Markets go risk-on in July
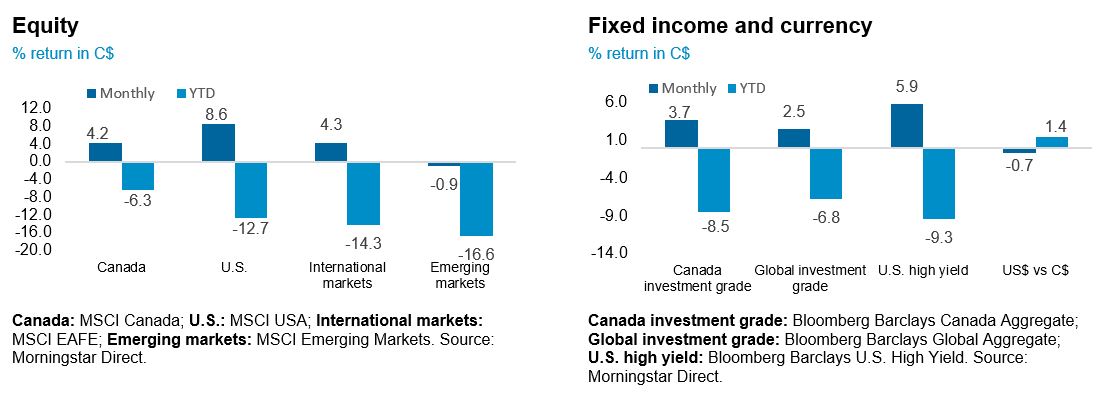
Risk-on behaviour was turned up in July with equites reversing some of its year-to-date losses, especially in the growth segment of the market. Equities generally outperformed bonds during the month. The appetite for risk assets has been prompted by market expectations that the Fed may have to be slower in its hiking cycle given already tightening financial conditions. These sentiments have been expressed in the futures market with a significant repricing since mid-June, as the market now expects that the Fed will be unable to hike rates meaningfully beyond the neutral rate.
The NEI perspective
Risk is back as the market reprices Fed action. Risk-on behaviour was turned up in July with equites reversing some of its year-to-date losses, especially for growth stocks. The market repriced for a Fed pivot, as weak economic data increased expectations the Fed will need to cut rates more quickly in 2023.
Q2 Earnings came in fairly strong, but forward guidance points to weakness in Q3. Stocks moved up a leg higher as Q2 earnings came in better than expected against the backdrop of a weakening economy, rising labour and cost of good prices. However, weakening US and European PMI data in July and softening economic data, points to continued macro risks to earnings.
Equity bear market rally or sustained rally? Over the next few months, we expect to see short bouts of rallies followed by periods of market downturns, as the market struggles to find direction. Market uncertainty will persist, but there may be a silver lining as historical data shows that stocks typically have been up double digits above their trough by the time the economy bottoms, which is typically four months before the end of a recession.
Performance (price return)

As of July 30, 2022
Part 1: The Balanced Portfolio
In Part 1 of our 2-part series, we discuss the “60/40” portfolio and our outlook. In Part 2, we will discuss the benefits of a fixed income portfolio vs GICs. Stay tuned for the second installment in the next Monthly Market Insights.
A traditional “60/40” balanced portfolio consists of investing 60% in equities and 40% in fixed income.
Why own a 60/40 portfolio?
The rationale behind owning this combination of the two asset classes is the offsetting interplay between them. Over the past two decades, there has been a broadly negative correlation between the two asset classes, where one acts as a buffer for the other. Stock prices typically fall in a weakening economy, which tends to be positive for bonds due to the prevailing risk-off sentiment and potential for interest rate cuts. On the flip side, a booming economy tends to occur alongside rising rates and higher inflation, both of which are negative for bonds. Thus, the stability of bonds helps temper the inherently higher volatility of stocks in the portfolio.
The 2022 anomaly: fixed income and equities experience positive correlation
Since the start of the year, both fixed income and equities have had negative returns. This is a historical anomaly, being only the second occasion in four decades when both asset classes have posted losses for two consecutive quarters. The “four headwinds” of market volatility such as high and persistent inflation, aggressive central bank rate hikes, elevated commodity prices following Russia’s invasion of Ukraine, and now recession risks have together created the perfect storm for both asset classes.
What lies ahead for the 60/40 portfolio?
While there has been much pain to investors since the start of the year, we believe that these declines have readjusted asset valuations and set the stage for better price performance ahead. History suggests after a 20% drop, equities tend to reward investors well. Over the next few months, we expect to see short bouts of rallies in equities followed by periods of market downturn as the market struggles to find direction given market uncertainty, prompted by recession risks and central bank action, both of which are hinged on the path of inflation. However, the silver lining in the historical data shows that stocks typically have been up double digits above their trough by the time the economy bottoms.
In the fixed income space, yields have increased materially and the “income is back in fixed income”. Expected return for bond investors over long periods of time tends to gravitate towards the yield to maturity at purchase. This bodes well for fixed income investors moving forward. However, a risk to watch for is the path of inflation which could determine how both asset classes perform on a go forward basis.

Source: Bloomberg, data as of July 31, 2022
Interesting obersvations
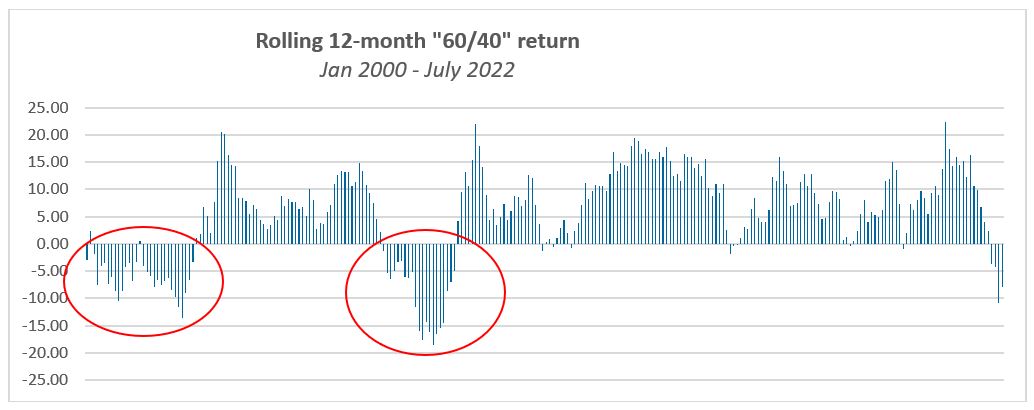
- Extended periods of rolling 12-month negative returns (circled in red) tend to be followed by extended periods of positive performance.
- There was a 24% and 76% probability of receiving a negative and positive return respectively over the rolling 12-month periods from Jan 2000 to July 2022.
- In this chart the fixed income component is represented by Bloomberg Global Aggregate Total Return (Hedged in CAD) Index. The equity component is represented by the MSCI ACWI Total Return Index (in CAD).
